起因
Node-exporter 采集数据有断图的问题, 排查发现/metrics接口 rt 很高, 大概都需要 1-3s 左右.
1 | # time curl http://127.0.0.1:9199/metrics -o ne.txt |
优化
主旨就是做减法
1.分析 metrics 构成
可以看到 ipvs 是占绝对的数据量大头, 但是正常的情况下是没有使用到这部分的 metrics的 , 所以调整Node Exporter 停止 ipvs 的采集
1 | # grep -v ^# ne.txt |grep -v ^go | wc -l |
在 Node Exporter 中 添加如下的启动命令, 丢弃 ipvs 相关的 metrics
1 | --no-collector.ipvs |
2.获取Pprof分析
再次测试访问耗时, 可以看到 rt 降低到 0.4s 左右.
1 | # time curl http://127.0.0.1:9199/metrics -o ne.txt |
采集 30s pprof数据
1 | curl -o /tmp/cpu_profile.prof "http://localhost:9100/debug/pprof/profile?seconds=30" |
启动分析
1 | go tool pprof -http=:8080 node_exporter.go /tmp/cpu_profile.prof |
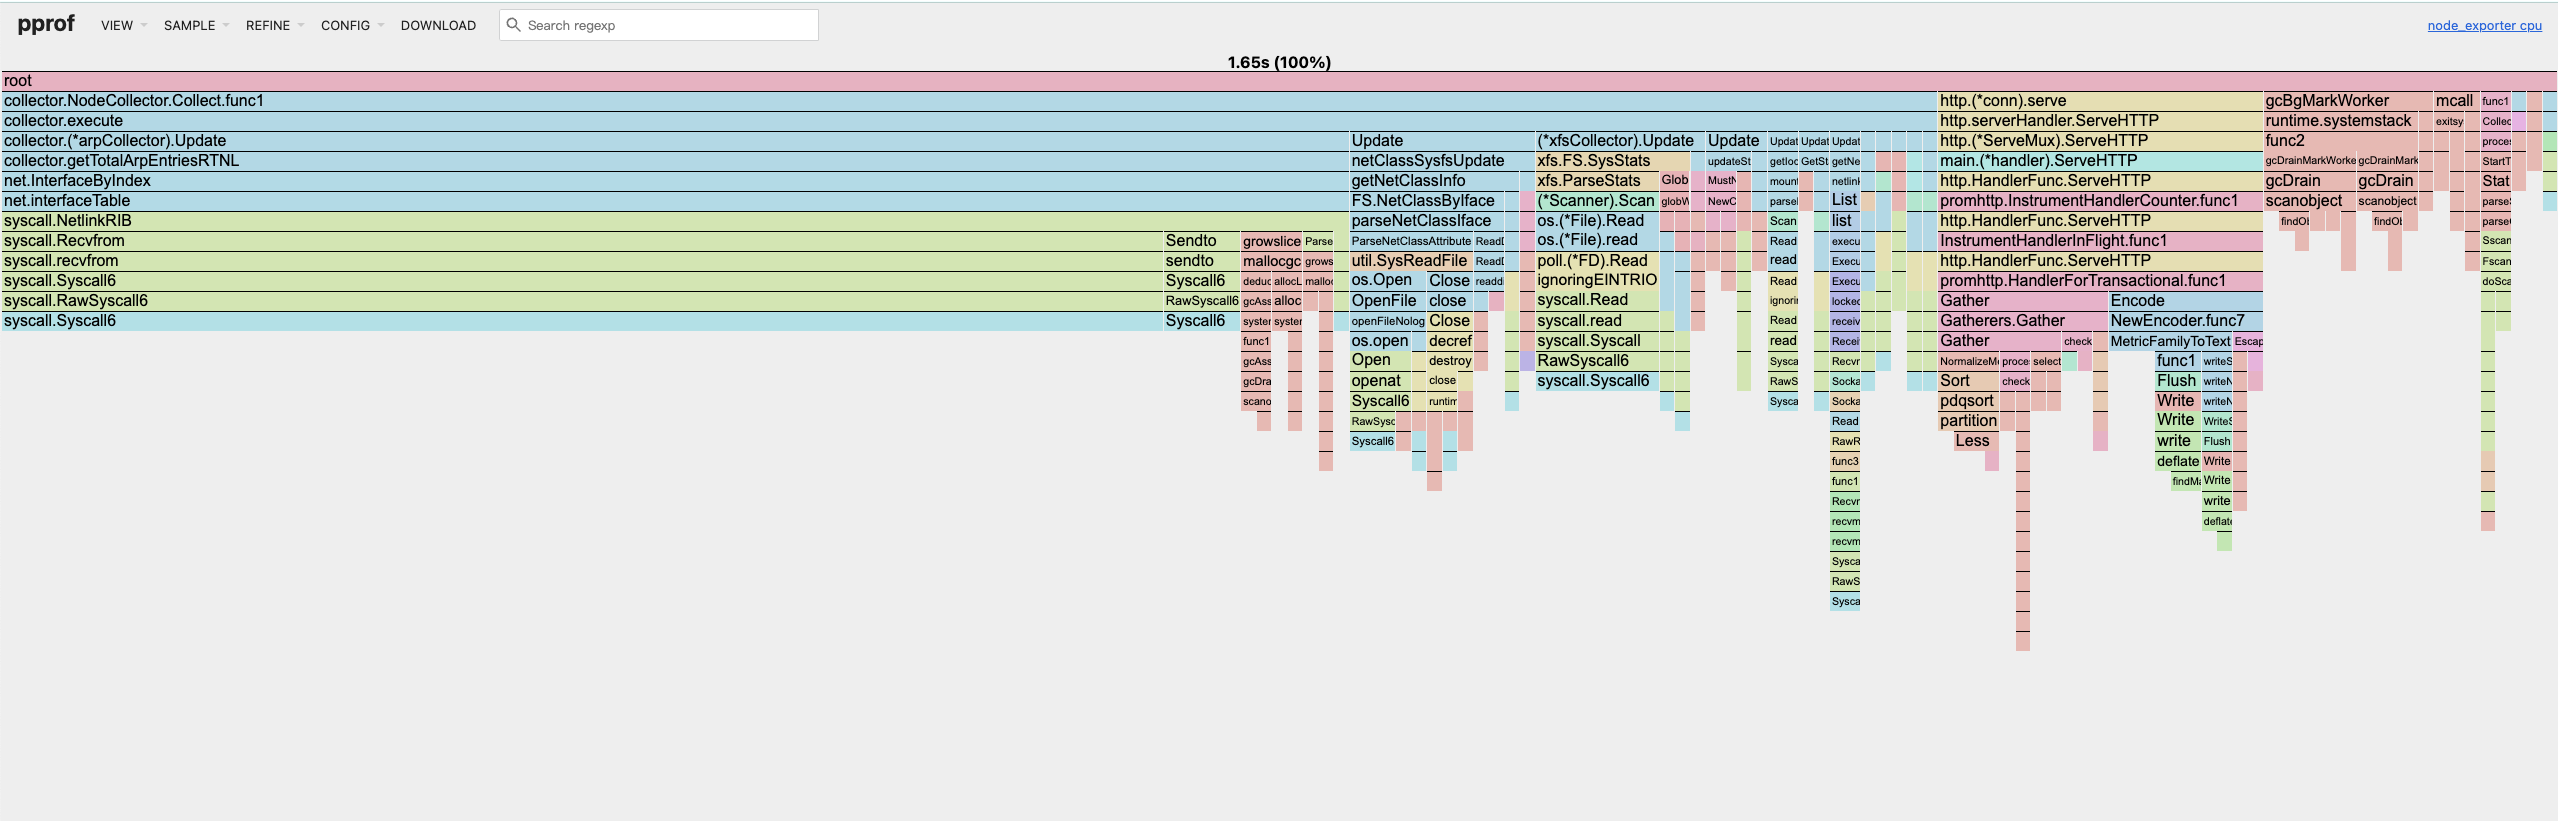
观察如下CPU火焰图, 可以看到大部分的耗时在arp 数据的采集中, 但是这部分数据一般情况下也不会使用到
这里的情况因人而异, 只是提供一个思路
在 Node Exporter 中 添加如下的启动命令, 直接丢弃
1 | --no-collector.arp |
优化结果
再次测试访问耗时, 可以看到 rt 降低到 0.01s 左右.
1 | # time curl http://127.0.0.1:9199/metrics -o ne.txt |
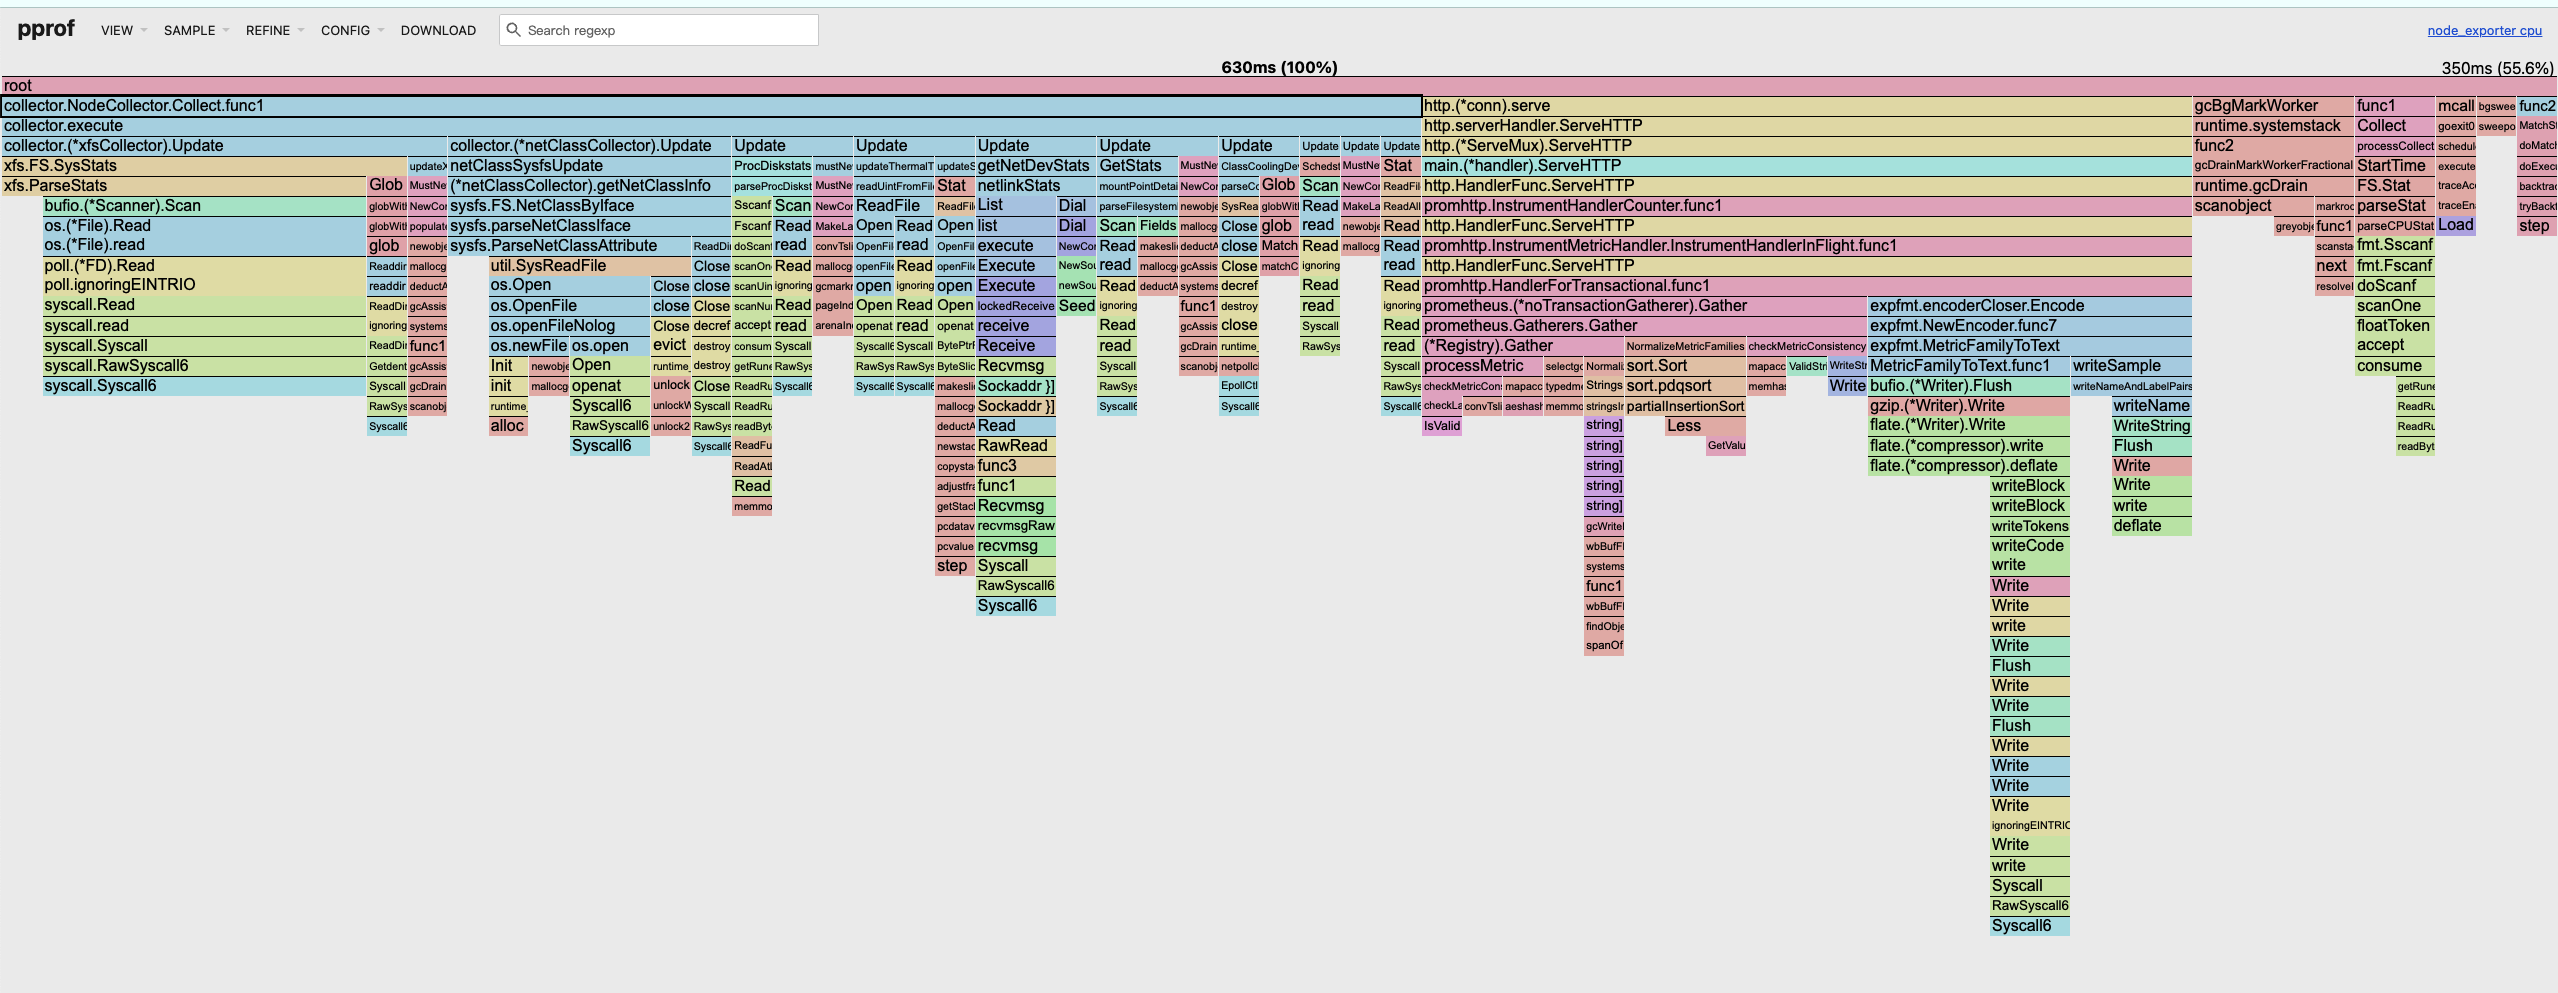
再对 CPU 耗时进行分析, 可以看到绝大部分的开销都在必要的数据上