前言
公司机器总数100台左右 , 没有监控 , 总是在机器挂了才知道. 业务问题也只能依靠测试报障.
因为内部涉及多个K8s集群. 每个环境有独立的监控,日志收集系统, 所以需要一个All IN ONE的运维监控系统.
尝试过grafana+ Mimir + Loki的方式.二次开发成本过大, 并且短期内不能有效告警. 遂放弃. 接着尝试夜莺V5.以下是实践过程.
以下监控会从系统运维,业务运维,数据库运维等几个方面来进行监控系统搭建.
监控搭建
夜莺搭建
https://github.com/ccfos/nightingale
这里选用最简单的Docker Compose 方式创建夜莺. 正如文档所说如果不是Docker专家, 不建议以这样的形式创建.

启动命令如下所示.
1
2
3
| git clone https://gitlink.org.cn/ccfos/nightingale.git
cd nightingale/docker
docker compose up -d
|
服务启动之后,浏览器访问nwebapi的端口,即18000,默认用户是root,密码是root.2020
主机监控安装
这里的主机监控agent 选用的grafana-agent, grafana-agent 集成了绝大部分会使用到的exporter, 做到了All IN ONE.
并且支持Push 模式,简化流程, 这样在流程上只需要在主机启动时,预装grafana-agent, 由grafana-agent主动Push 到中心即可.
安装脚本如下所示:
这个脚本有如下几个注意点:
remote_write 地址要根据自己部署夜莺的地址修改,将x.x.x.x更换为自己的IP即可
$_hostip: 这个建议写为主机IP, 因为对运维来说IP才是最直观的数据
1
2
3
4
5
6
7
8
9
10
11
12
13
14
15
16
17
18
19
20
21
22
23
24
25
26
27
28
29
30
31
32
33
34
35
36
37
38
39
40
41
42
43
44
45
46
47
48
49
50
51
52
53
54
55
56
57
58
59
60
61
62
63
| function InstallMonitor(){
[ ! -f /usr/local/bin/grafana-agent ] && wget -O /usr/local/bin/grafana-agent https://lcc-init.oss-cn-hangzhou-internal.aliyuncs.com/grafana-agent
chmod +x /usr/local/bin/grafana-agent
mkdir -p /metrics /etc/grafana-agent
cat >/etc/systemd/system/grafana-agent.service <<EOF
[Unit]
Description="grafana-agent"
After=network.target
[Service]
Type=simple
ExecStart=/usr/local/bin/grafana-agent -config.file /etc/grafana-agent/grafana-agent.yml
WorkingDirectory=/usr/local/bin
SuccessExitStatus=0
LimitNOFILE=65536
StandardOutput=syslog
StandardError=syslog
SyslogIdentifier=grafana-agent
KillMode=process
KillSignal=SIGQUIT
TimeoutStopSec=5
Restart=always
[Install]
WantedBy=multi-user.target
EOF
chmod 0644 /etc/systemd/system/grafana-agent.service
cat >/etc/grafana-agent/grafana-agent.yml <<EOF
server:
log_level: info
http_listen_port: 12345
metrics:
wal_directory: /metrics
global:
scrape_interval: 15s
scrape_timeout: 10s
remote_write:
- url: http://x.x.x.x:19000/prometheus/v1/write
integrations:
agent:
enabled: true
node_exporter:
enabled: true
instance: "$_hostip"
include_exporter_metrics: true
process_exporter:
enabled: true
instance: "$_hostip"
process_names:
- name: "{{.Comm}}"
cmdline:
- '.+'
EOF
systemctl daemon-reload
systemctl enable --now grafana-agent
}
|
BlackBox Exporter
下载地址: https://github.com/prometheus/blackbox_exporter/releases
下载二进制文件并解压到/usr/local/bin/
安装脚本如下:
1
2
3
4
5
6
7
8
9
10
11
12
13
14
15
16
17
18
19
20
21
22
23
24
25
26
27
28
29
30
31
32
33
34
35
36
37
38
39
40
41
42
43
44
45
46
47
48
49
50
51
52
53
54
55
56
57
58
59
60
61
62
63
64
65
66
67
68
69
70
71
72
73
74
75
76
77
78
| function InstallBlackboxExporter(){
cat >/etc/systemd/system/blackbox_exporter.service <<EOF
[Unit]
Description="blackbox_exporter"
After=network.target
[Service]
Type=simple
ExecStart=/usr/local/bin/blackbox_exporter --config.file=/etc/blackbox-exporter/blackbox.yml
WorkingDirectory=/usr/local/bin
SuccessExitStatus=0
LimitNOFILE=65536
StandardOutput=syslog
StandardError=syslog
SyslogIdentifier=blackbox_exporter
KillMode=process
KillSignal=SIGQUIT
TimeoutStopSec=5
Restart=always
[Install]
WantedBy=multi-user.target
EOF
chmod 0644 /etc/systemd/system/blackbox_exporter.service
cat >/etc/blackbox-exporter/blackbox.yml <<EOF
modules:
http_2xx:
prober: http
http_post_2xx:
prober: http
http:
method: POST
tcp_connect:
prober: tcp
pop3s_banner:
prober: tcp
tcp:
query_response:
- expect: "^+OK"
tls: true
tls_config:
insecure_skip_verify: false
grpc:
prober: grpc
grpc:
tls: true
preferred_ip_protocol: "ip4"
grpc_plain:
prober: grpc
grpc:
tls: false
service: "service1"
ssh_banner:
prober: tcp
tcp:
query_response:
- expect: "^SSH-2.0-"
- send: "SSH-2.0-blackbox-ssh-check"
irc_banner:
prober: tcp
tcp:
query_response:
- send: "NICK prober"
- send: "USER prober prober prober :prober"
- expect: "PING :([^ ]+)"
send: "PONG ${1}"
- expect: "^:[^ ]+ 001"
icmp:
prober: icmp
EOF
systemctl daemon-reload
systemctl enable --now blackbox_exporter
}
|
Mysqld Exporter
下载地址: https://github.com/prometheus/mysqld_exporter
下载二进制文件并解压到/usr/local/bin/
需要监听的数据库执行如下SQL:
xxxxx替换为你设定的密码
1
2
3
4
| create user 'exporter'@'%' identified by 'xxxxx';
GRANT PROCESS, REPLICATION CLIENT, SELECT ON *.* TO 'exporter'@'%' WITH MAX_USER_CONNECTIONS 3;
flush privileges;
|
安装脚本如下:
mysqld_exporter.cnf: 中密码账户为上面执行SQL创建的用户密码.
1
2
3
4
5
6
7
8
9
10
11
12
13
14
15
16
17
18
19
20
21
22
23
24
25
26
27
28
29
30
31
32
33
34
35
36
37
38
39
| function InstallMysqldExporter(){
cat >/etc/systemd/system/mysqld_exporter.service <<EOF
[Unit]
Description="mysqld_exporter"
After=network.target
[Service]
Type=simple
ExecStart=/usr/local/bin/mysqld_exporter --config.my-cnf=/etc/mysqld_exporter.cnf --collect.auto_increment.columns --collect.binlog_size --collect.global_status --collect.global_variables --collect.info_schema.innodb_metrics --collect.info_schema.innodb_cmp --collect.info_schema.innodb_cmpmem --collect.info_schema.processlist --collect.info_schema.query_response_time --collect.info_schema.tables --collect.info_schema.tablestats --collect.info_schema.userstats --collect.perf_schema.eventswaits --collect.perf_schema.file_events --collect.perf_schema.indexiowaits --collect.perf_schema.tableiowaits --collect.perf_schema.tablelocks --collect.slave_status
WorkingDirectory=/usr/local/bin
SuccessExitStatus=0
LimitNOFILE=65536
StandardOutput=syslog
StandardError=syslog
SyslogIdentifier=mysqld_exporter
KillMode=process
KillSignal=SIGQUIT
TimeoutStopSec=5
Restart=always
[Install]
WantedBy=multi-user.target
EOF
chmod 0644 /etc/systemd/system/mysqld_exporter.service
cat >/etc/mysqld_exporter.cnf <<EOF
[client]
user=exporter
password=xxxx
host=x.x.x.x
port=3306
EOF
systemctl daemon-reload
systemctl enable --now mysqld_exporter
}
|
consul + consul-template 动态生成配置
安装 Consul
-bind 和 -client 需要替换为本机IP
1
2
3
4
5
6
7
8
9
10
11
12
13
14
15
16
17
18
19
20
21
22
23
24
25
26
27
28
29
30
31
32
33
34
35
| function InstallConsul(){
yum-config-manager --add-repo https://rpm.releases.hashicorp.com/RHEL/hashicorp.repo
yum -y install consul
mkdir -p /data/consul
cat >/etc/systemd/system/consul.service <<EOF
[Unit]
Description="consul"
After=network.target
[Service]
Type=simple
ExecStart=/usr/bin/consul agent -server -bootstrap-expect 1 -bind=x.x.x.x -client=x.x.x.x -data-dir=/data/consul -node=agent-one -config-dir=/etc/consul.d -ui
WorkingDirectory=/usr/bin/
SuccessExitStatus=0
LimitNOFILE=65536
StandardOutput=syslog
StandardError=syslog
SyslogIdentifier=consul
KillMode=process
KillSignal=SIGQUIT
TimeoutStopSec=5
Restart=always
[Install]
WantedBy=multi-user.target
EOF
chmod 0644 /etc/systemd/system/consul.service
systemctl daemon-reload
systemctl enable --now consul
}
|
安装Consul-template
安装脚本如下所示:
x.x.x.x 替换为夜莺地址 , a.b.c.d 替换为consul部署地址
1
2
3
4
5
6
7
8
9
10
11
12
13
14
15
16
17
18
19
20
21
22
23
24
25
26
27
28
29
30
31
32
33
34
35
36
37
38
39
40
41
42
43
44
45
46
47
48
49
50
51
52
53
54
55
56
57
58
59
60
61
62
63
64
65
66
67
68
69
70
71
72
73
74
75
76
77
78
79
80
81
82
83
84
85
86
87
88
89
90
91
92
93
94
95
96
97
98
99
100
101
| wget https://releases.hashicorp.com/consul-template/0.29.0/consul-template_0.29.0_linux_amd64.zip
unzip consul-template_0.29.0_linux_amd64.zip
chmod +x consul-template
mv consul-template /usr/local/bin/consul-template
mkdir -p /etc/consul-template/template
cat > /etc/consul-template/consul-template.conf << EOF
log_level = "warn"
syslog {
enabled = true
facility = "LOCAL5"
}
consul {
address = "a.b.c.d:8500"
retry {
enabled = true
attempts = 12
backoff = "250ms"
max_backoff = "3m"
}
}
template {
source = "/etc/consul-template/templates/url-monitor.ctmpl"
destination = "/home/nightingale-main/docker/prometc/conf.d/url/url.yaml"
command = "curl -X POST http://x.x.x.x:9090/-/reload"
command_timeout = "60s"
backup = true
wait {
min = "2s"
max = "20s"
}
}
template {
source = "/etc/consul-template/templates/icmp-monitor.ctmpl"
destination = "/home/nightingale-main/docker/prometc/conf.d/icmp/icmp.yaml"
command = ""
command_timeout = "60s"
backup = true
wait {
min = "2s"
max = "20s"
}
}
EOF
cat > /etc/consul-template/consul-template.conf/template/url-monitor.ctmpl <<EOF
- targets:
{{- range ls "blackbox/url/http200" }}
- http://{{ .Key }}{{ .Value }}
{{- end }}
EOF
cat > /etc/consul-template/consul-template.conf/template/icmp-monitor.ctmpl <<EOF
{{- range ls "blackbox/icmp" }}
- targets:
- {{ .Key }}
labels:
instance: {{ .Key }}
{{- end }}
EOF
cat > /etc/systemd/system/consul-template.service <<EOF
[Unit]
Description="consul-template"
After=network.target
[Service]
Type=simple
ExecStart=/usr/local/bin/consul-template -config /etc/consul-template/consul-template.conf
WorkingDirectory=/usr/local/bin
SuccessExitStatus=0
LimitNOFILE=65536
StandardOutput=syslog
StandardError=syslog
SyslogIdentifier=consul-template
KillMode=process
KillSignal=SIGQUIT
TimeoutStopSec=5
Restart=always
[Install]
WantedBy=multi-user.target
EOF
systemctl daemon-reload
systemctl enable --now consul-template.service
|
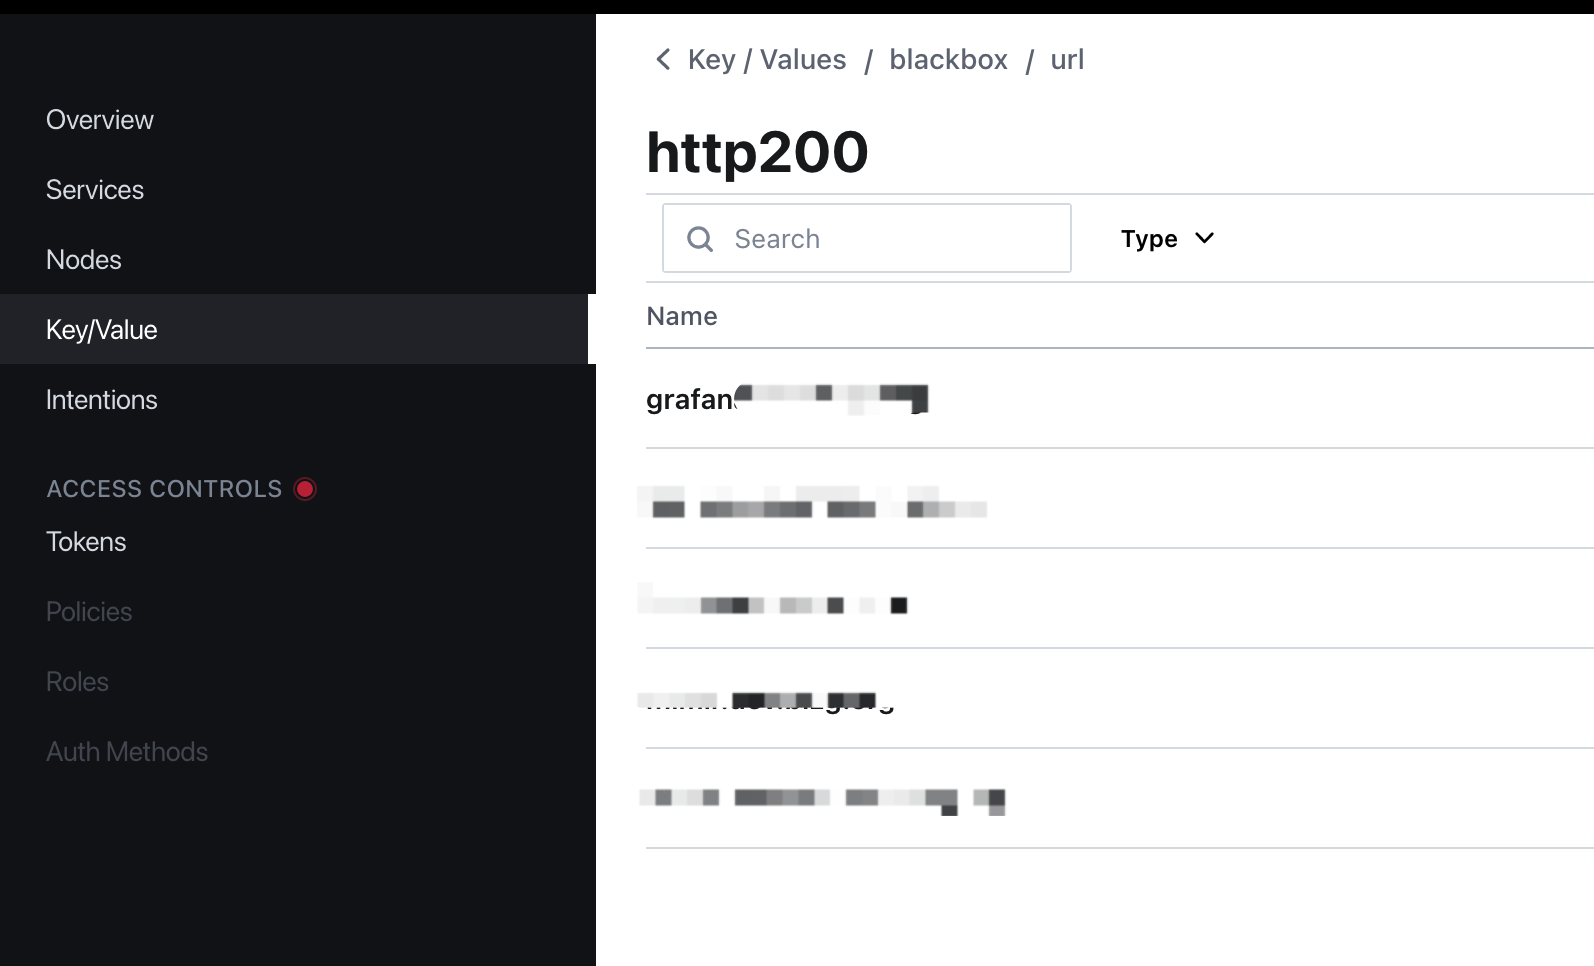
配置Consul K/V 动态生成URL监控
添加如下K/V,K/V 对应上文*.ctmpl 文件中渲染地址. 在这里Key 为域名,Values 为路径
修改Promtheus配置
nightingale-main/docker/prometc/prometheus.yml追加如下内容:
1
2
3
4
5
6
7
8
9
10
11
12
13
14
15
16
17
18
19
20
21
22
23
24
25
26
27
28
29
30
31
32
33
34
35
36
37
38
39
| - job_name: MySQL
static_configs:
- targets:
- x.x.x.x:9104
labels:
instance: MySQL-dev
- job_name: process
static_configs:
- targets:
- x.x.x.x:9256
- job_name: 'blackbox-url-monitor'
metrics_path: /probe
params:
module: [http_2xx]
file_sd_configs:
- refresh_interval: 1m
files:
- ./conf.d/url/*.yaml
relabel_configs:
- source_labels: [__address__]
target_label: __param_target
- source_labels: [__param_target]
target_label: instance
- target_label: __address__
replacement: x.x.x.x:9115
- job_name: 'blackbox-icmp-monitor'
scrape_interval: 1m
metrics_path: /probe
params:
module: [icmp]
file_sd_configs:
- refresh_interval: 1m
files:
- ./conf.d/icmp/*.yaml
relabel_configs:
- source_labels: [__address__]
target_label: __param_target
- target_label: __address__
replacement: x.x.x.x:9115
|
在nightingale-main/docker/prometc/ 下创建目录conf.d. 命令如下:
1
2
| cd nightingale-main/docker/prometc/
mkdir -p conf.d/{icmp,url}
|
重启promtheus,命令如下所示:
1
| docker restart prometheus
|
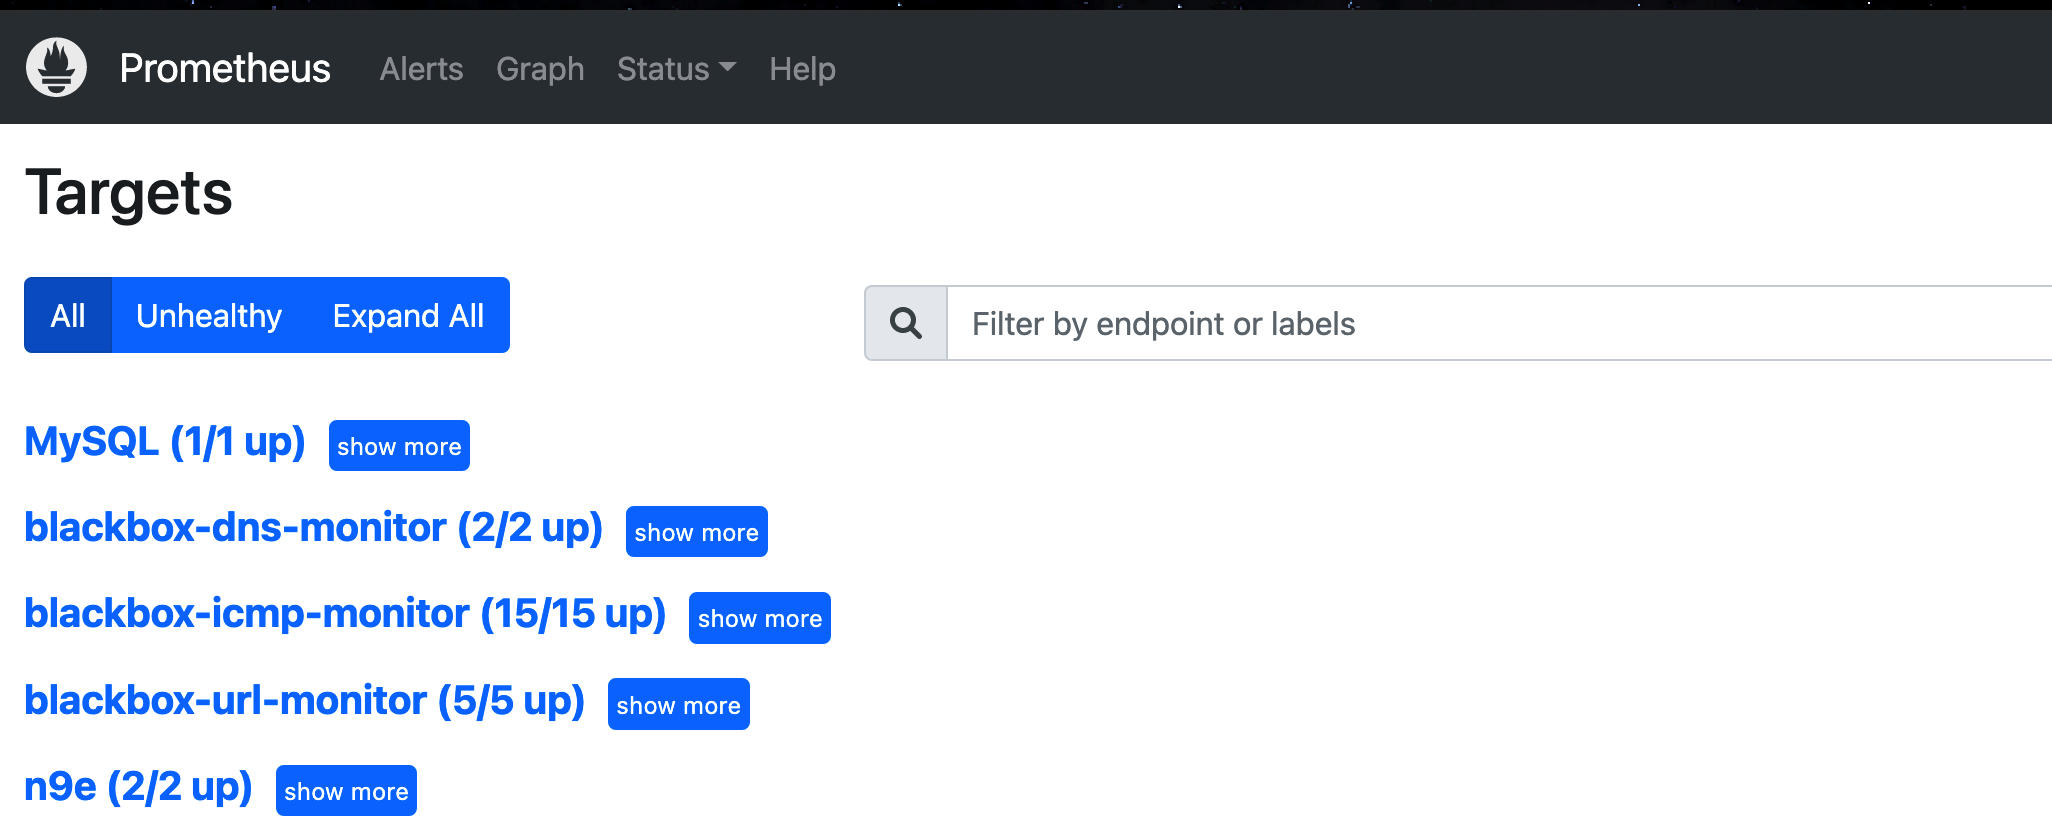
重启后检查prometheus状态
日志监控搭建
感谢夜莺社区支持.
- 大前提, 夜莺版本高于5.9.2
- 已有Loki. 并且Loki已经支持多租户.
Loki的配置在这里不做赘述,网上教程太多了.
docker-compose.yml 追加如下内容, 与nserver 同级
1
2
3
4
5
6
7
8
9
10
11
12
13
14
15
16
17
18
19
20
21
22
23
24
25
26
27
| lokinserver:
image: registry.cn-hangzhou.aliyuncs.com/lcc-middleware/nightingale:5.9.2
container_name: lokinserver
hostname: nserver
restart: always
environment:
GIN_MODE: release
TZ: Asia/Shanghai
WAIT_HOSTS: mysql:3306, redis:6379
volumes:
- ./lokin9eetc:/app/etc
ports:
- "20000:20000"
networks:
- nightingale
depends_on:
- mysql
- redis
- prometheus
- ibex
links:
- mysql:mysql
- redis:redis
- prometheus:prometheus
- ibex:ibex
command: >
sh -c "/wait && /app/n9e server"
|
生成lokinserver容器的配置文件.操作如下.
1
2
| cp -r n9eetc lokin9eetc
cd lokin9eetc
|
修改lokin9eetc/server.conf文件中Reader`字段,内容如下:
如果开启多租户记得传Headers, 如果没开,则去除Headers字段
Loki的API中带loki前缀的都是兼容prometheus风格的API 所以一定要加. Prom字段替换为自己的域名
1
2
3
4
5
6
7
8
9
10
11
12
13
14
15
16
17
18
19
| [Reader]
Url = "http://loki.xxx.xxx/loki/"
BasicAuthUser = ""
BasicAuthPass = ""
Timeout = 30000
DialTimeout = 10000
TLSHandshakeTimeout = 30000
ExpectContinueTimeout = 1000
IdleConnTimeout = 90000
KeepAlive = 30000
MaxConnsPerHost = 0
MaxIdleConns = 100
MaxIdleConnsPerHost = 10
Headers = ["X-Scope-OrgID","lcc-loki"]
|
修改配置文件nightingale-main/docker/n9eetc/webapi.conf, 追加如下内容
如果开启多租户记得传Headers, 如果没开,则去除Headers字段
Loki的API中带loki前缀的都是兼容prometheus风格的API 所以一定要加. Prom字段替换为自己的域名
1
2
3
4
5
6
7
8
9
10
11
12
13
14
15
16
17
18
19
20
21
| [[Clusters]]
Name = "Loki"
Prom = "http://loki.xxx.xxx/loki/"
BasicAuthUser = ""
BasicAuthPass = ""
Timeout = 30000
DialTimeout = 10000
TLSHandshakeTimeout = 30000
ExpectContinueTimeout = 1000
IdleConnTimeout = 90000
KeepAlive = 30000
MaxConnsPerHost = 0
MaxIdleConns = 100
MaxIdleConnsPerHost = 100
Headers = ["X-Scope-OrgID","lcc-loki"]
|
重启夜莺监控:
告警规则配置
系统运维
CPU利用率 > 90
1
| (100-(avg by (mode, instance)(rate(node_cpu_seconds_total{mode="idle"}[1m])))*100) > 90
|
Innode 利用率>90
1
| (100 - ((node_filesystem_files_free * 100) / node_filesystem_files))>90
|
sshd 服务挂了
1
| (namedprocess_namegroup_num_procs{groupname="sshd"}) == 0
|
内存利用率 > 95
1
| (node_memory_MemTotal_bytes - node_memory_MemFree_bytes - (node_memory_Cached_bytes + node_memory_Buffers_bytes))/node_memory_MemTotal_bytes*100 > 95
|
文件句柄 > 90
1
| (node_filefd_allocated{}/node_filefd_maximum{}*100)
|
IO wait > 30%
1
| avg by (instance) (rate(node_cpu_seconds_total{mode="iowait"}[5m])) * 100 > 30
|
过去一分钟IOutil > 80
1
| (rate(node_disk_io_time_seconds_total{} [1m]) *100) > 80
|
Ping > 1s
1
| avg_over_time(probe_icmp_duration_seconds[1m]) > 1
|
平均负载>2
1
| (avg(node_load1) by(instance)/count by (instance)(node_cpu_seconds_total{mode='idle'})) >2
|
TCP重传率>5%
1
| (rate(node_netstat_Tcp_RetransSegs{}[5m])/ rate(node_netstat_Tcp_OutSegs{}[5m])*100) > 5
|
磁盘利用率 > 85%
1
| (100 - ((node_filesystem_avail_bytes * 100) / node_filesystem_size_bytes) ) > 85
|
节点重启
1
| node_reboot_required > 0
|
业务运维
我们是GO应用,其他应用根据需要设定
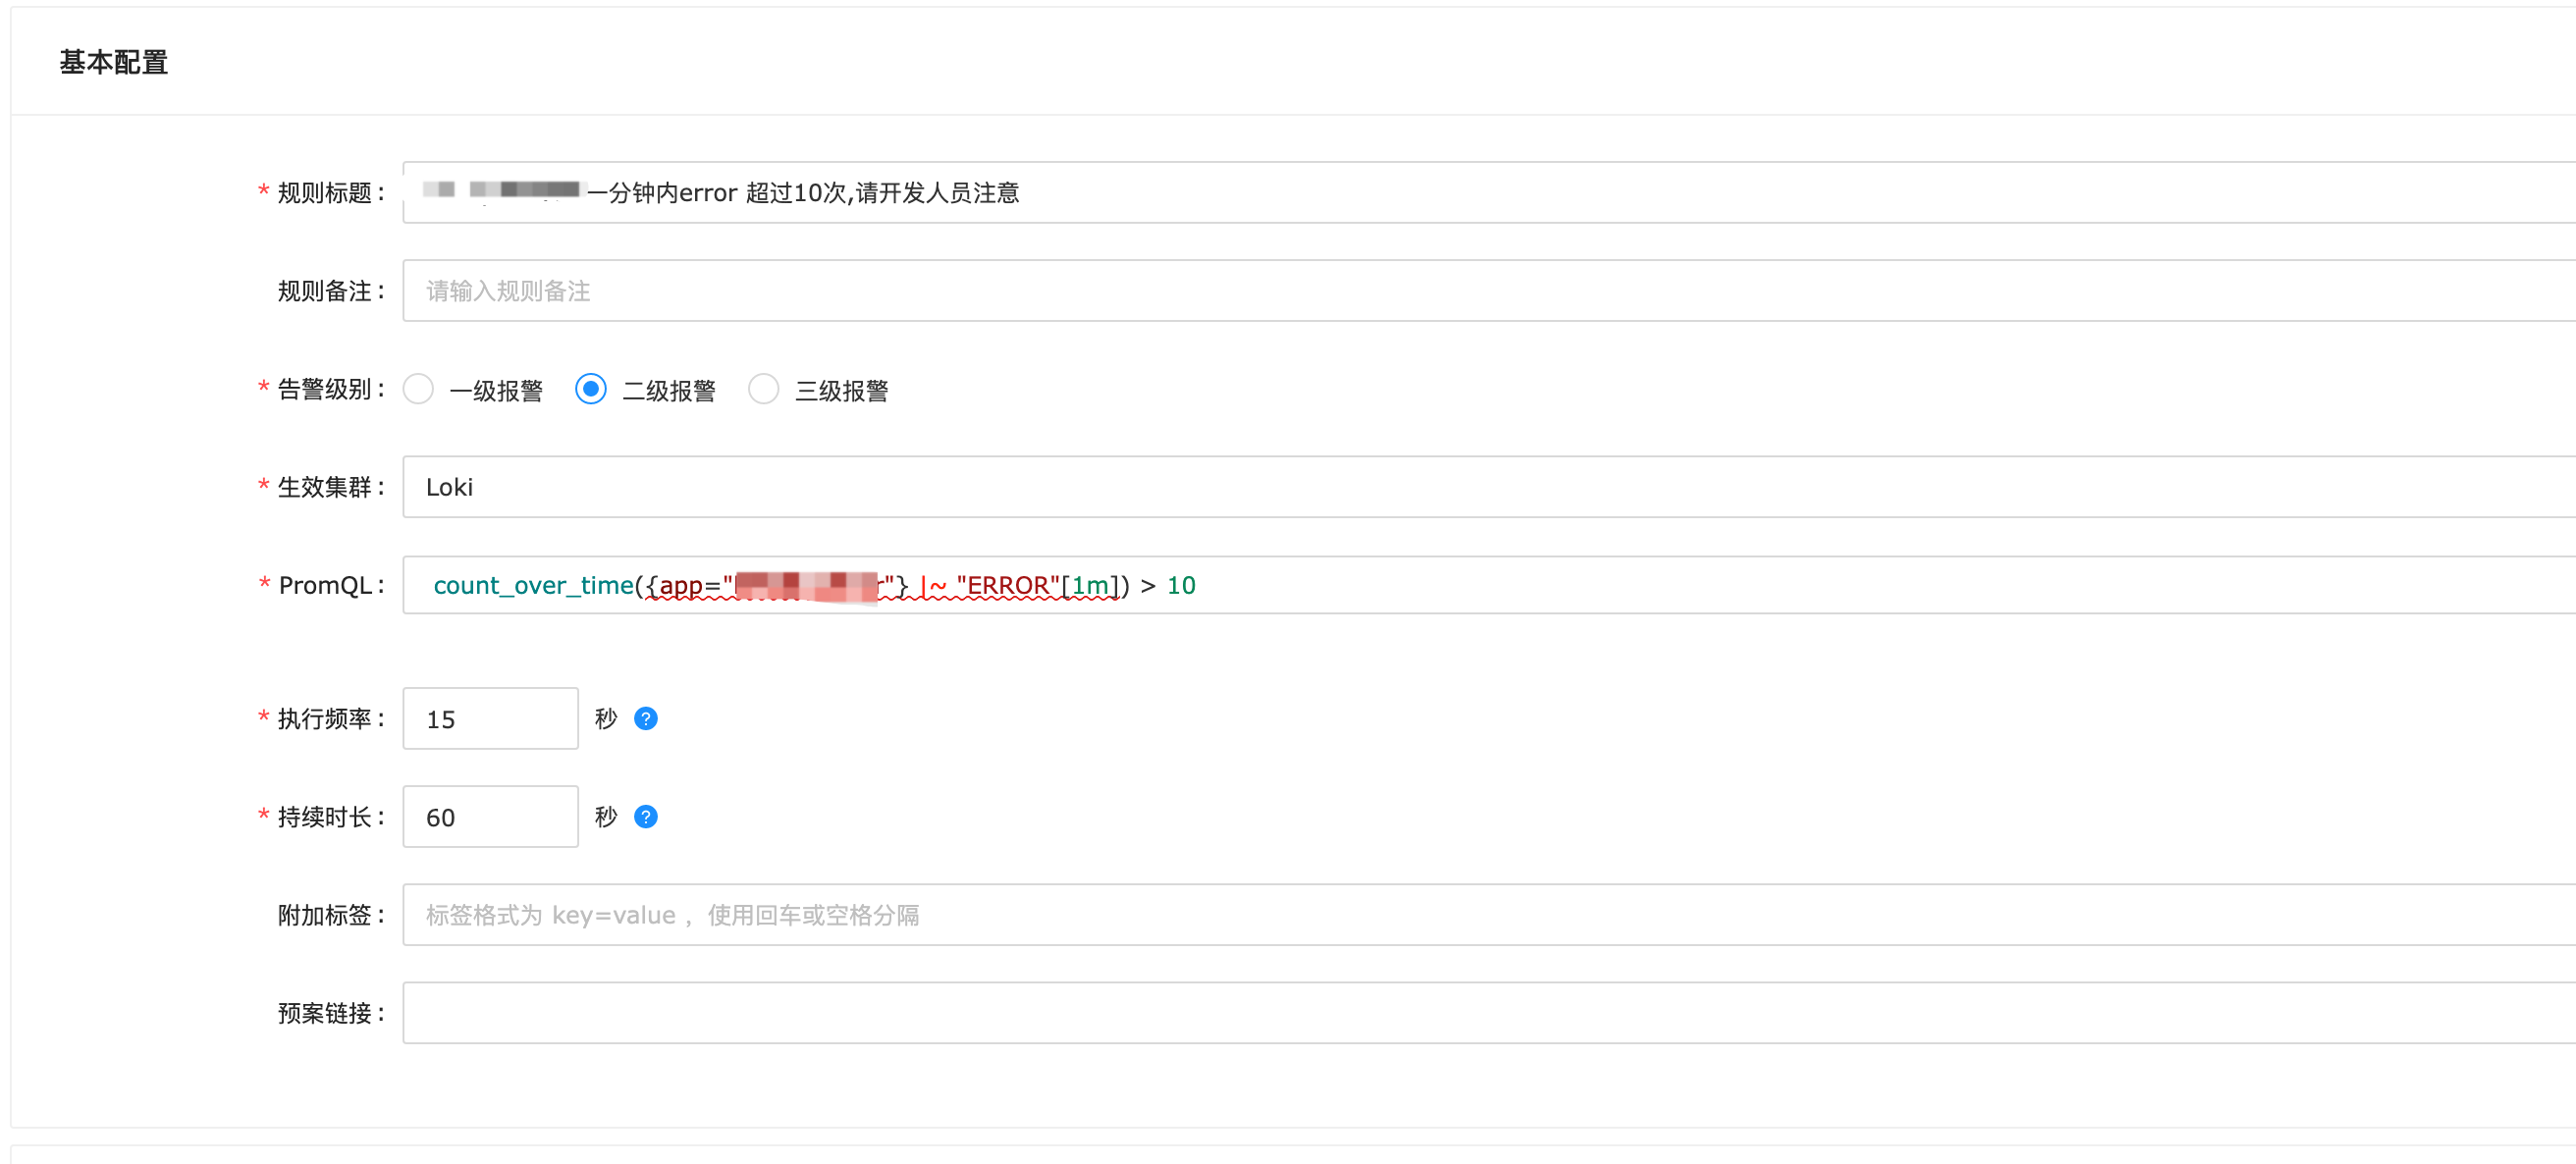
一分钟内日志ERROR>10
日志这里主要选,我们上面添加的Loki集群
URL探测不通
1
| probe_http_status_code <= 199 OR probe_http_status_code >= 400
|
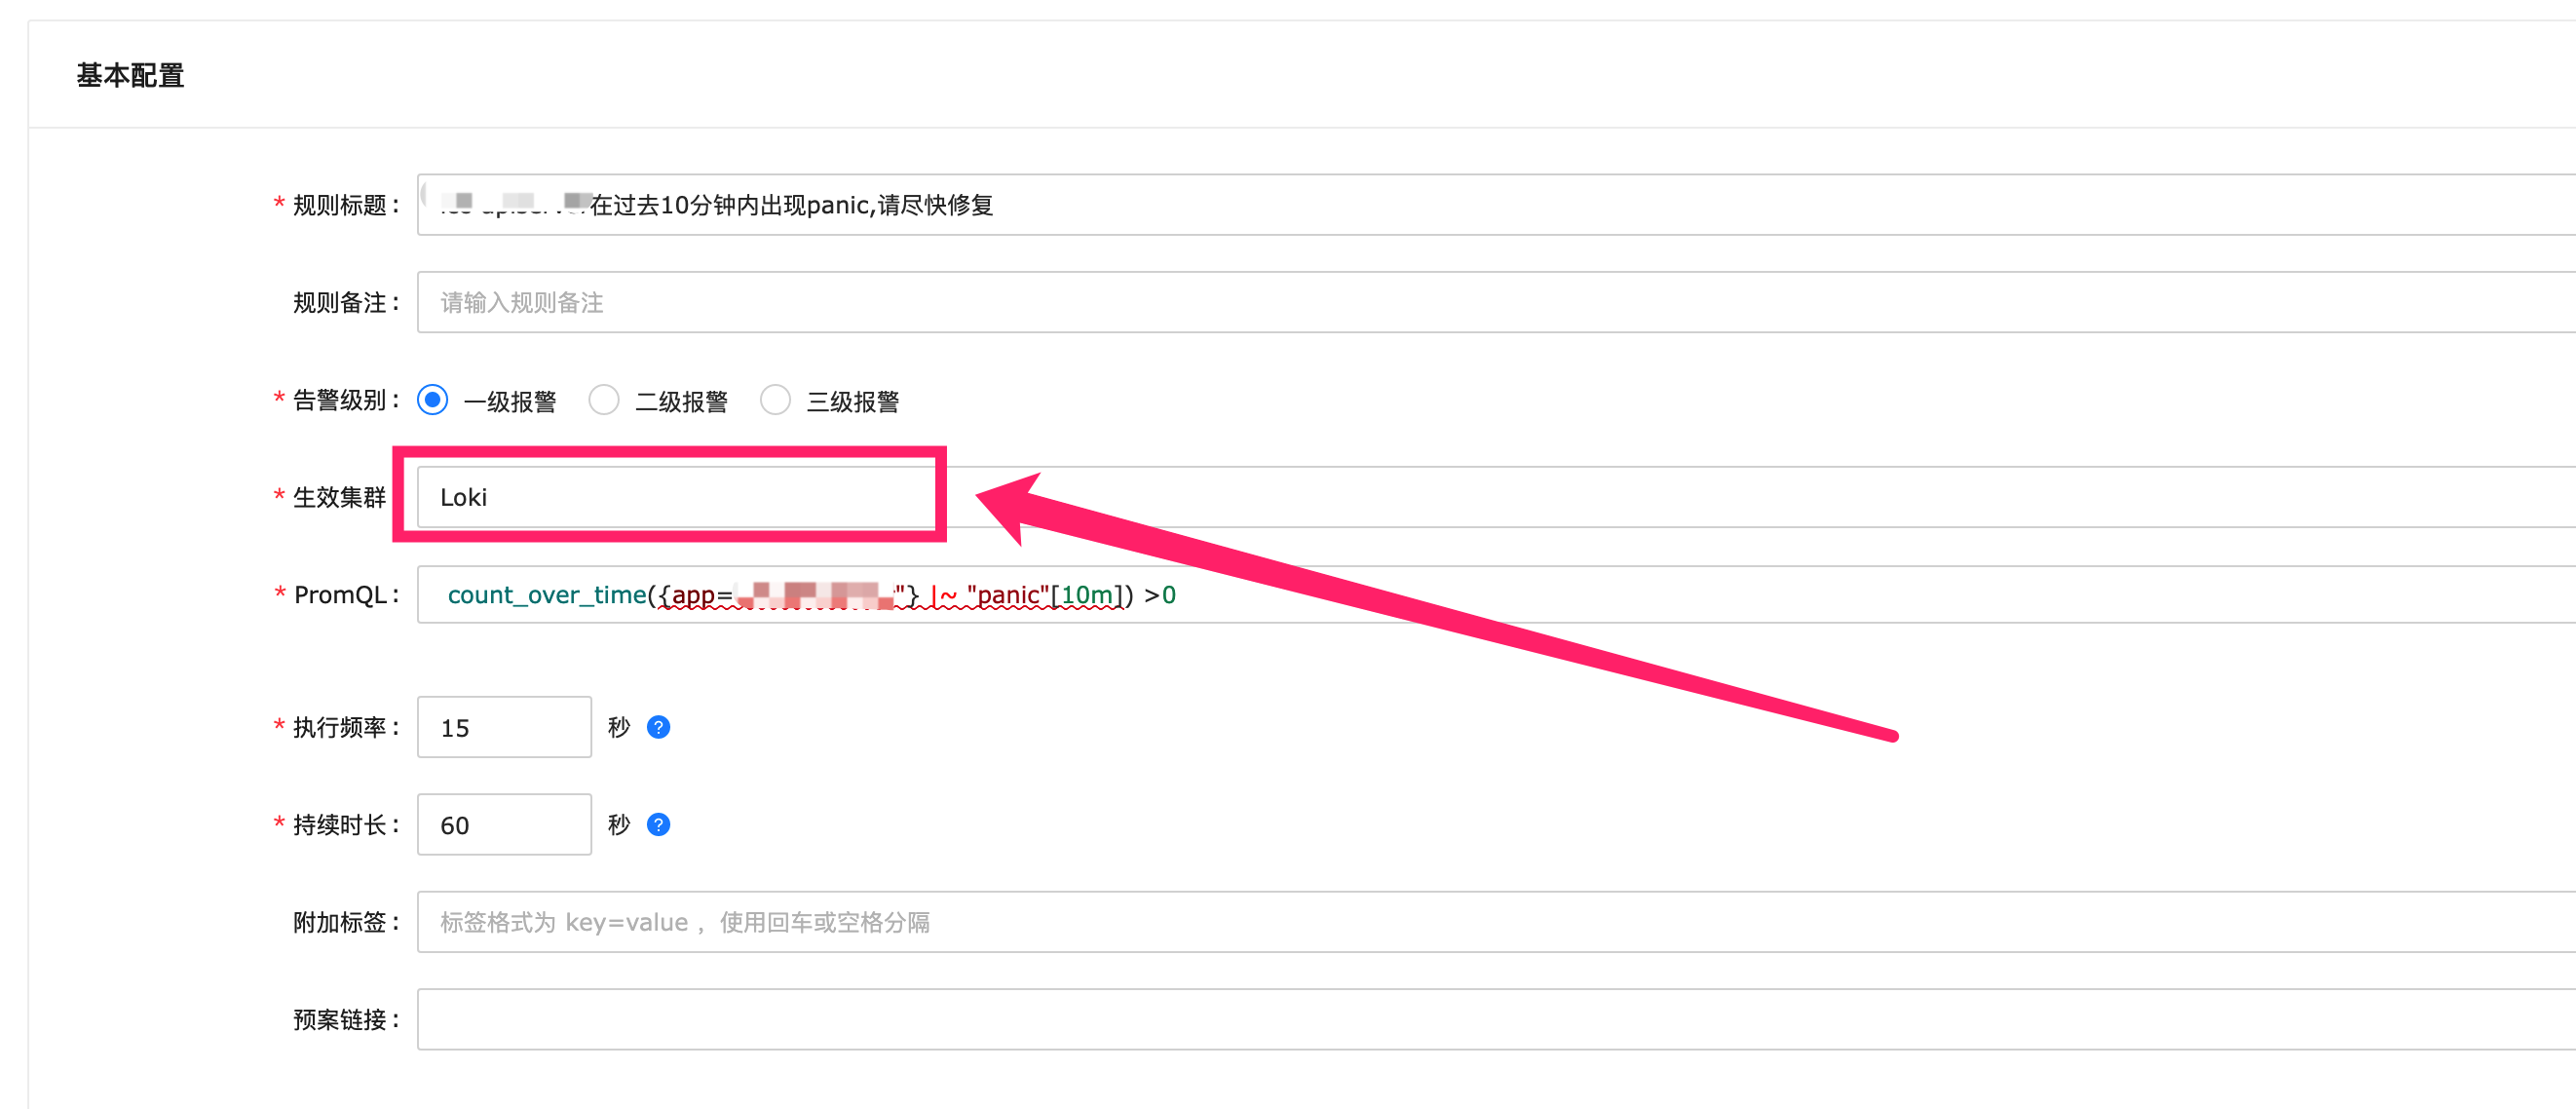
过去一分钟出现Panic
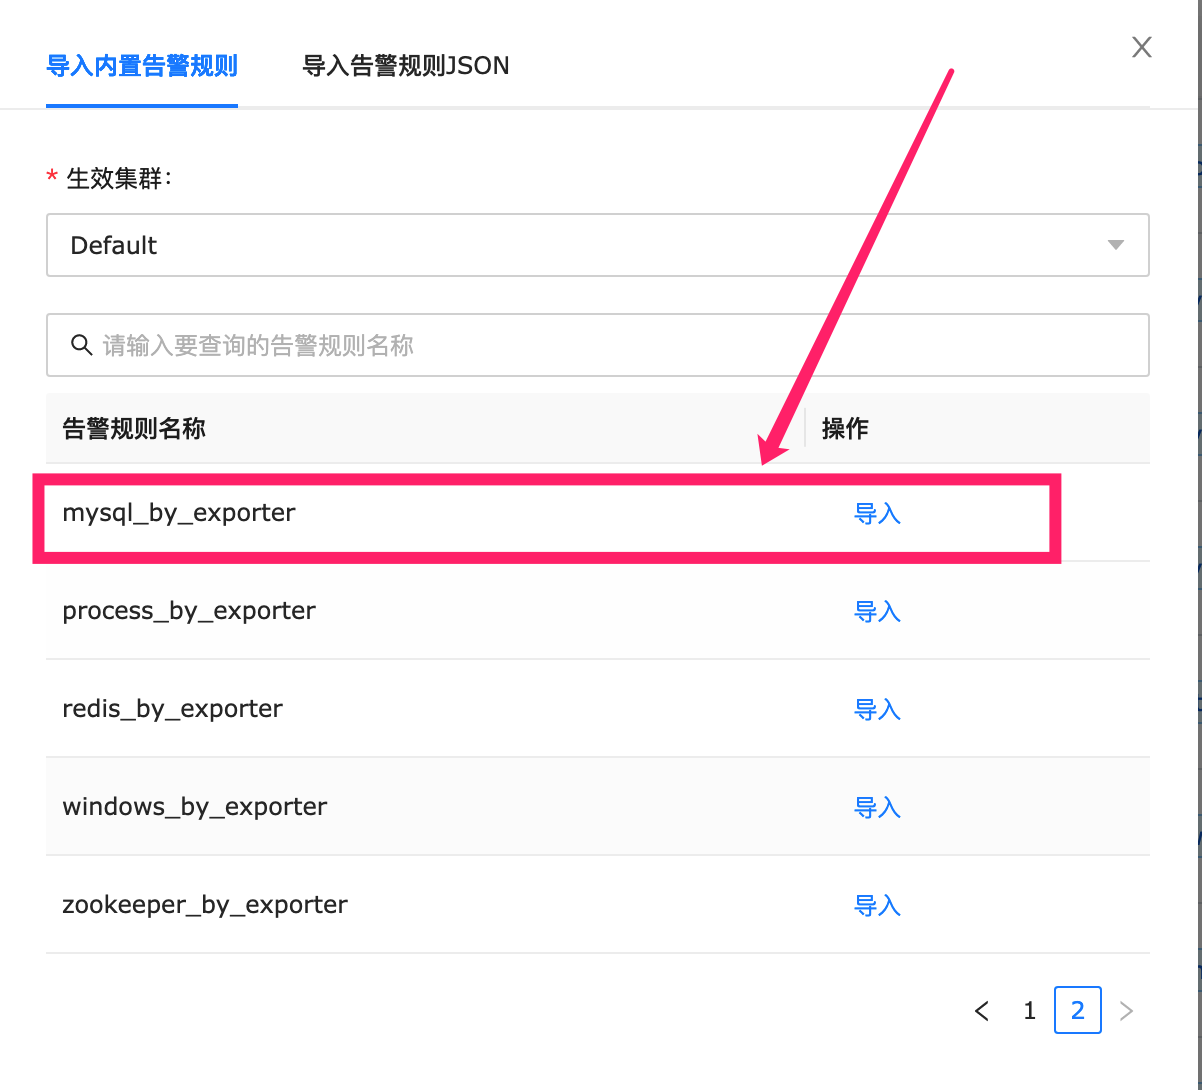
数据库运维
仅罗列部分, 更多可以在导入规则中查找
数据库重启
1
| mysql_global_status_uptime < 60
|
连接数超过80%
1
| avg by (instance) (mysql_global_status_threads_connected) / avg by (instance) (mysql_global_variables_max_connections) * 100 > 80`
|
最近一分钟有慢查询
1
| increase(mysql_global_status_slow_queries[1m]) > 0
|
